
Over the past 62 trading days, the FTSE 100 has displayed a pattern between 9am-11am EDT that has repeated itself 47 out of 62 times, or slightly better than 75 percent of the time. If you followed the rules of this strategy, and got in on every trade, then your trade would have expired successfully 47 out of 62 times.
Today, it looked like an exception to the rule was coming into play. The setup looked dangerous, and the trade required patience for the right entry.
But first, here are the rules for the 9am-11am FTSE 100 "Footsie" Strategy:
 |
| Click on Nadex Chart to Enlarge |
The same phenomenon occurs with the 7am-9am German "Strudel" strategy that I have written about extensively. Complete rules for the "Strudel" strategy are included in the free eBook from TradingPub, entitled "Trading Made Simple: Strategies that Risk $100 or Less".
The rules for this new strategy are very simple to execute:
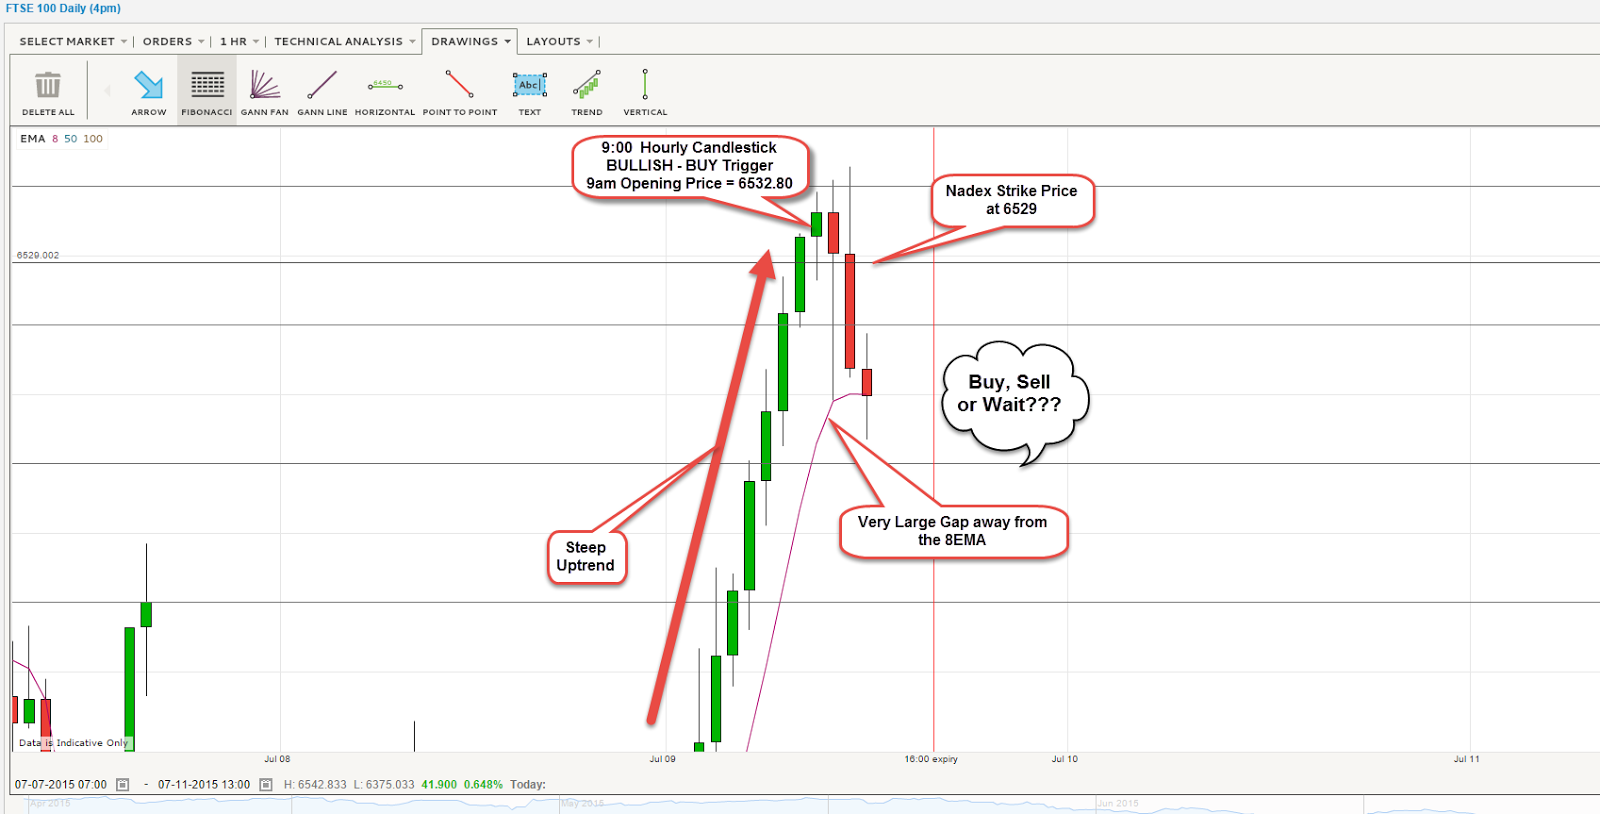
- Select the 9am-11am EST Nadex time period for the FTSE 100 Index.
- If the 9am EST hourly candlestick is BULLISH, then BUY at the first Nadex strike price available BELOW the opening price of the 9am hourly candlestick.
- If the 9am EST hourly candlestick is BEARISH, then SELL at the first Nadex strike price available ABOVE the opening price of the 9am hourly candlestick.
This strategy has been very consistent over the past 3 months. Just be patient and watch the 9am hourly candlestick develop. Once it's confirmed bullish, then buy. If it's confirmed bearish, then sell. If you want to be "super-safe", don't make a trading decision until 10am, after the 9am hourly candlestick has closed.
Trading this strategy today required patience and caution, as the chart below illustrates:
 |
| Nadex Hourly Chart of the FTSE 100 Index. Click on Chart to Enlarge |
The FTSE 100 Index had been riding a very steep uptrend for 7 consecutive hours going into the 9am hour. The 9am hourly candlestick was also developing bullish, but it was also gapping significantly away from the 8 EMA indicator. When the market gaps away from the 8 EMA (also known as the "T-Line") it almost always has to come back. It's like a rubber band. You can pull the market away from the 8 EMA, but it always snaps back.
With a bullish 9am hourly candle, it would normally automatically trigger a BUY at the first strike price below the 9am open. But I didn't like how far the market had gapped away from the 8EMA, and I sensed it would snap back with a vengeance. So I decided to sit on the sidelines and wait to see what the market would do.
Sure enough, the market snapped back with a vengeance. It blew through the strike price, and kept going all of the way down until it touched the 8 EMA.
So now I had a decision to make. Will the market reverse direction and head back north, and settle above the 1st strike price below the 9am open? With 40 minute left in the trade, it sure didn't look like it. But I reminded myself that this strategy has a 75% success rate, and a reversal looked like it was imminent. If I placed that trade, it was an Out-of-the-money trade, risking only $30 to make $70 per contract. Low risk, high reward. I pulled the trigger and went for it. Here's how the trade played out.
 |
| 5 Minute Nadex Chart. Click on Chart to Enlarge |

Conclusion:
In hindsight, this was a trade I probably should have passed on. It wound up working out exactly as I had predicted, but it could have easily lost. The market had to dive sharply toward the 8 EMA, and then bounce back up. I also had to have confidence in the recent historical probability of success. Those were two variables I had to trust before I pulled the trigger. But since I was only risking $30 per contract for a potential $70 reward, I wasn't too nervous.
Try this Strategy Out for Yourself. Download a 2 Week Nadex Demo.
Nadex is now available for trading in 47 countries. You will have complete access to the Nadex trading platform, and your demo account will be funded with $25,000 in play money.
To view a other high-probability Nadex trading strategies, click below:
The Purpose of this Blog
Disclaimer
The opinions expressed in this blog are solely those of the author, and should not be construed as trading advice. I am not a registered or certified financial planner. There is a very high degree of risk involved in trading. Past results are not indicative of future returns. All individuals affiliated with this site assume no responsibilities for your trading and investment results. The indicators, strategies, columns, articles and all other features are for educational purposes only and should not be construed as investment advice. Information for futures trading observations are obtained from sources believed to be reliable, but we do not warrant its completeness or accuracy, or warrant any results from the use of the information. Your use of the trading observations is entirely at your own risk and it is your sole responsibility to evaluate the accuracy, completeness and usefulness of the information. You must assess the risk of any trade with your broker and make your own independent decisions regarding any securities mentioned herein.