Wednesday, April 6, 2022

Options Watchlist Trade Raytheon ($RTX)


Source: Raytheon Missile and Defense


Before I begin this post, I want to stress that this is my opinion only and this post is intended for educational purposes only. This post should not be construed as investment advice.

I am a relative newbie to options trading. I only buy calls if I think an asset is going up, or I buy puts when I think an asset will go down in price. I am also aware that most options expire worthless. 

One major thing I have learned about trading options is that time decay can decimate a trade that once looked good. The key, in my opinion, is to get in and get out when an attractive profit is on the table.

Let's take a look at Raytheon.

As the Russian invasion of Ukraine was in full swing it was announced that Ukrainian President Zelensky was going to make a speech before Congress on March 16.

I thought there would be no doubt that he make an impassioned speech requesting a massive influx of  military and humanitarian aid. It got me making a list of assistance that I would want if I was asking hot help. One of those items would be Stinger Missiles, manufactured by Raytheon.

These surface to air missiles can be rapidly deployed into the field and are highly effective at shooting down helicopters and aircraft.

On March 15, I looked at the daily chart for RTX  and I liked what I saw


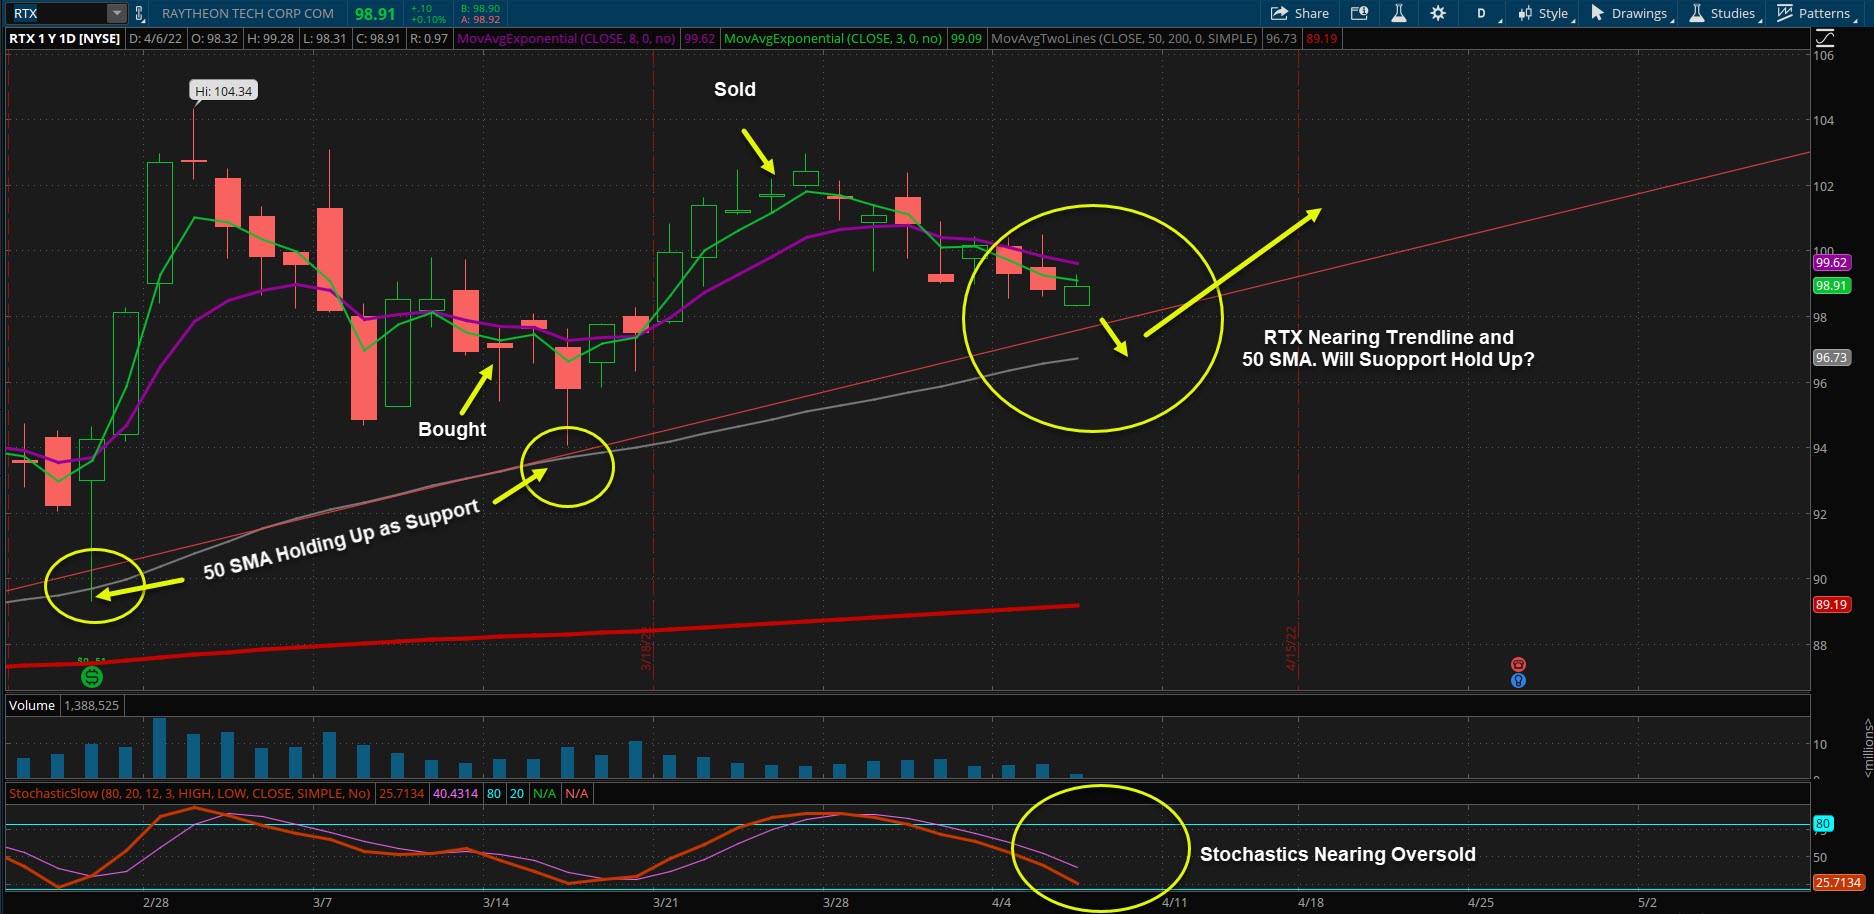
The stock had pulled back from a recent earnings pop and looked like it was poised to continue heading up. 

I placed an options order on March to buy the June 17  RTX $100 Calls for $4.70 per contract. Since 1 contract controls 100 shares, the cost for placing this trade was $470.

On March 16, Zelensky made his speech to Congress, and there were few dry eyes in the room. That day, RTX dropped down to the 50 MA and a trend line. My option declined in value from $4.70 to $3.60 in value. In my mind, there was no reason to panic on that trade.

On March 17, massive military aid was announced to Ukraine include the transfer of 800 Stinger missiles and 2,000 Javelin missiles, also manufactured by Raytheon and Lockheed Martin. Most recently, Raytheon just completed a successful test flight of a hypersonic missile, in conjunction with Northrop Grumman.

RTX moved up impressively after March 17. One week later, on March 24, the RTX contract I was holding was trading at $630 and I sold it for a 34% profit $160.

Why did I sell the option? Three reasons.

  1. Notice the relationship between the Green Line (3EMA) and the Purple Line (8EMA). Whenever the Green Line gaps too far away from the Purple Line, it snaps back like a rubber band.

  2. Time decay in options can spoil the best laid plans

  3. Greed kills
What's Next for RTX?

What's next is anyone's guess, but here's what I see in the charts.

  • RTX is moving back down to the Support trend line and the 50 . Will this area hold up as support as it has done in the past? We'll see.

  • Stochastics are moving back to oversold territory. Looking at the chart for RTX, recent history shows that RTX does not remain oversold for more than a couple of days before moving back up.

  • This war is continuing it's ugly path, and NATO is galvanizing in support of Ukraine. The Stinger, Javelin and other anti-aircraft/anti-tank missiles as well as other defense technologies will be rapidly deployed and fired, which will probably prompt replacement orders. Other NATO countries may stock up their arsenals as well.
RTX may rise in value or it may fall, but for now, it's definitely on my watch list.

Thursday, December 10, 2020

Are the Markets Due for a Short-Term Correction?


The markets have been exuberantly  bullish since Election Day on November 3.

In spite of election challenges, unemployment news, and a global sense of unease about food and housing security, the markets have continued to churn upward at a very bullish clip.

The certification of election results, coupled with the distribution of a Covid-19 vaccine are continuing to fuel bullish momentum.

And Wall Street continues to be optimistic, citing strong 4th quarter numbers and a positive outlook going forward. "I do think we hit rock bottom , and we're growing", said JP Morgan Chase's Jaime Dimon at a virtual teleconference.

From a technical standpoint however, the markets have been very "toppy".


The emini S&P 500 Futures have been travelling aggressively above the T-Line (8 EMA), shown in purple.  Price moved down to the T-Line on December 9, and broke below the T-Line on December 10 largely due to a dismal jobs report.

IF price closes below the T-Line, then I could easily see selling pressure coming into play.

First target: 3550, where price was previously in consolidation

Second target: 3000, or when the market touches the 50 SMA, shown in gray.

If this happens, it's quite possible that this will be just a normal correction.

On December 15, the Electoral College votes will be certified. Barring a major surprise, the markets could resume their bull run.

Wednesday, October 28, 2020

Markets Take the Stairs Going Up, and the Elevator Going Down


When markets rally, it's usually a slow and deliberate climb on the way up. Just like taking the stairs walking up in a high-rise building. When markets sell off, the drop is usually fast and steep, just like taking the elevator on the way down.

Let's look at a daily chart of the US 500 Index.


Look at the difference between the length of each green daily candlestick on the way up. You will quickly notice that they are much smaller than the red candlesticks on the way down.

It's also important to note the relationship of the markets in relationship to  the "T-Line" (8 EMA), which is plotted in purple. On an uptrend, the market travels above the T-Line. On a downtrend, the market travels below the T-Line.

Finally, Stochastics (set at 12,3,3) can help you identify when markets are overbought or oversold, signaling a potential reversal. When it's above the 80 line, a move to the downside is imminent. If it's below the 20 line, a rally back to the upside is also imminent.

Election Week - What's happening?

The US Equity Indices (Dow, Nasdaq, S&P 500, Russell 2000) all broke sharply below the T-Line which suggested that strong selling pressure was in progress.

You can argue all day long as to why that is happening. Covid-19 surge, Stimulus deal delayed, Election-Day jitters prompting a wave of profit taking, or maybe a combination of all. To me, none of that matters. The charts graphically depict investor reaction to the events of the day.

How to trade this?

For my part, I have been extremely cautious over the past 2 weeks. While I trust the market's relationship with the T-Line, I'm also aware that markets can reverse sharply on a tweet.

So, I have consciously made the decision to reduce my exposure to risk through the General Election.

With Nadex, there are a few ways to do that:
  1. I can reduce the number of contracts I trade, thus limiting the amount of capital exposed to risk.
  2. I can adjust my risk per trade, risking less per contract for a greater reward.
  3. I can do both of the above
Stocks take the elevator going down, and this week has been a classic illustration of that adage.

On Tuesday evening at 6pm ET, Nadex opened with fresh new strikes for the following day. The markets closed bearish that day for the 2nd consecutive day, so the decision was made to follow the prevailing down trade, but also to choose a strike price that would reduce my exposure for risk, while maximizing potential gain.


I placed Limit Orders for the following US Equity Indices:

  • US 500 (Dec) >3363.0  Max Risk $40, Max Reward $60 per contract x 5 contracts
  • US SmallCap 2000 (Dec) >1570.0  Max Risk $30, Max Reward $70 per contract x 5 contracts
  • US Tech 100 (Dec) >11460  Max Risk $30, Max Reward $70 per contract x 5 contracts
  • Wall St. 30 (Dec) >27120  Max Risk $20, Max Reward $80 per contract x 5 contracts

  • I also placed 2 trades on Forex pairs. One trade one, the other was losing. They cancelled each other out.

    In total, I had $600 tied up in risk on the US Equity Trades.  By 8:30am ET, I closed those trades out for $965, representing a 160 percent return on capital risked overnight.

    Not a bad trade to wake up to. I decided to cash out with a handsome profit simply because there was no way of telling what the markets would do after the Opening Bell.

    This was a low risk, high reward approach to trading uncertainty in the week prior to the General Election.


      Thursday, October 15, 2020

      Using Knockouts to Trade the "Rubber Band" T-Line Trade


      In my last blog post, I talked about the "Rubber Band" T-Line Trade.

      While I'm not crazy about the name of this strategy, it does depict the relationship betwen the 3 Exponential Moving Average (EMA)against the T-Line (8 EMA).

      These 2 moving averages track along with each other, but the 3EMA occasionally gaps away from the T-Line. When that happens, just like a stretched rubber band, it always snaps back.

      You can catch some very nice price moves with Nadex, risking very little for a potentially nice gain. All you need to do is spot the gap away, and then look for the snap-back to happen.

      Today the  US 500 was on a down trend, and the 3 EMA was Gapping away from the T-Line on the 4-Hour charts.


      Notice how the Green 3 EMA gapped down away from the purple T-Line. Just like it has done in the past, the market was trying to make its way back to the T-Line.

      That's when I decided to try doing a Nadex "Knock-Out" Trade.


      Knockouts resemble traditional futures trades, with the exception that they have a hard floor and a hard ceiling. 

      In today's case I decided to go long at 11:41am from 3459.9. I chose the 3440-3490 Knockout spread. My maximum risk was approximately $200 for a maximum $300 reward. Each tick the market moves is equalized at $1.

      If price travels through the floor of the Knockout bracket, then I'm knocked out for the maximum $200 loss. If price travels through the ceiling of the knockout bracket then the trade closes, and I collect the maximum $300 profit.

      You are not married to the trade. You can exit any time you want to lock in profits or to pare losses.

      In this case, my profit target was a touch of the T-Line, about 70 or so ticks away.


      Sure enough, the market ground its way back up to the T-Line and I exited for a 65 Tick profit, or $65 on one contract traded.

      There are lots of ways to trade with Nadex, and Knockouts can be a nice way to capture sudden price moves.

      Wednesday, October 14, 2020

      The "Rubber Band" T-Line Trade


      What happens when you pull back on a rubber band? It snaps back, right?

      The same happens with price in the markets when you plot the 3 Exponential Moving Average (EMA) and 8 EMA on your charts. 

      The 8 EMA, also known as the T-Line, is an excellent indicator for determining whether a market is on an uptrend or on a down trend. Simply put, if price is traveling above the T-Line, then you are in an uptrend. If price is traveling below the T-Line, you are in a downtrend.

      The 3 EMA tracks along with the 8 EMA, but every time it gaps away too far, it snaps right back to the T- Line, as seen on the chart below.


      Notice what happens every time the 3 EMA (plotted in green) gaps away from the purple T-Line. It snaps back like a rubber band. In fact, the further it gaps away, the harder it is more likely to snap back.

      This can provide some excellent trading opportunities if you spot the 3 EMA gapping away from the T-Line.

      In the daily chart above you can see that the US 500 futures are bullish, but also gapping above the T-Line. Looking at the intraday 15-minute charts, the US 500 started to plunge. 

      Knowing where the market had the potential to drop to, I chose to SELL the US 500 with Nadex Binary Options as soon as price started to plummet at a price level nearer to the T-Line.


      This was a low-risk, high reward trade. I sold 5 contracts, risking $14 to make $86 per contract with a daily expiry of 4:15pm ET. My maximum risk was $70 for a maximum reward of $430.

      Within 90 minutes, the market dove through my strike price and kept diving, like the rubber band snapping back. This trade was flashing a profit of $398.75 and I opted to close the trade for a 560% return on capital risked with in 90 minutes.

      When you plot the 3 EMA and the 8 EMA on your charts, it will expose some prime opportunities to capture fast intraday price movements.


      Wednesday, September 23, 2020

      Using the 80 Percent Rule in Your Trading


      If your charting platform supports Market Profile or Volume Profile, then there is a way to identify potential large moves in price during the day. 

      Volume/Market Profile shows you where 70% of the previous day's transactions occurred. Without getting too deep into Volume/Market Profile, there is one trading strategy called the 80% Rule.


      In this 15-Minute chart of the emini S&P 500 futures, the gray box represents the Value Area Box. Again this box depicts where 70% of price volume occurred during the previous day.

      The 80% Rule

      If price enters the Value Area Box and remains inside the box for an hour or so, then there's an 80% chance, that price will travel to the other side of the box.

      In this example, price dropped down and penetrated through the Value Area Box at 10:45am ET. By noon, it had traveled down halfway through the box.

      Anticipating a move to the bottom of the box, I selected a strike price at >3265 for a SELL order, near the bottom of the box.

      Since the >3265 strike price was well below the price at around noon, I was able to place the trade with low risk for high reward.

      Contract Details:

      11:58 EDT: SELL US 500 (Dec) <3265 for $78.75 per contract
      Trade Expiration: Daily at 4:15pm EDT
      Number of Contracts: 10
      Max Risk, per Contract: $21.25 for $212.50
      Max Reward per Contract: $78.75 for $787.50

      Here's what happened...


      After moving against me briefly on a pullback, price took a hard dive through the bottom of the Value area box and blew through the strike price.

      At 3:01 EDT, I decided to Exit the trade, with a BUY for $10.25 for a $68.50 profit per contract traded, or $685.00, less exchange fees of $20.

      The 80% rule can provide a great opportunity to capitalize on price movement if you spot the opportunity.

      Friday, September 4, 2020

      Riding a Rollercoaster Week


      The U.S. markets had been on a nice, steady progressive uptrend for the past several weeks.

      Wednesday was no exception and then the markets gapped-up huge. Would the bull market continue on Thursday? To my way of thinking, why not. I placed my bullish orders on all the US Equity Indices, risking $50 to make $50 per contract. 

      A shared my bullish market out look with a mentor, Stephen Bigalow. He advised me to be careful, explaining that a large gap-up can also result in profit-taking coming in. While I had the opportunity to back out of my orders for a tiny loss, I decided to stay in the trade.

      Stephen was right, and I got run over. When I woke up in the morning, I was deep in the red. All of my trades closed for total losses. In all, $1,500 was lost.

      While that hurts, there was a silver lining to this trade.

      1. With Nadex, there is a maximum risk on every trade. Sure, I lost $50 per contract, but in Thursday's free-fall, it could have been much, much worse. I'm sure many futures and stock traders felt run over.
      2. I only exposed 2% of my account on each trade. I can recover from that.
      Sure, Thursday sucked. But I was glad that I stuck to risk management. Losses happen.

      Okay, On to Friday...

      Here was my thought process for Friday:

      "Bull Markets take the stairs on the way up. Bear Markets take the elevator on the way down."

      With the steep selloff on Thursday, I expected continued profit-taking going into the Labor Day Weekend. This got me thinking about placing some out-of-the-money SELL trades on the indices.

      At 6pm ET, when Nadex opened on Thursday night. I placed limit SELL orders on the four US indices,  at strike prices where I could get $25 risk for $75 reward. 

      SELL US 500 (Sep) >3428 @ $75 (6 Contracts)  Max Risk: $150  Max Reward $450
      SELL US SmallCap 2000 >1541.0 @ $75 (6 Contracts)  Max Risk: $150  Max Reward $450
      SELL US Tech 100 (Sep) >11608 @ $75 (6 Contracts)  Max Risk: $150  Max Reward $450
      SELL Wall St. 30 (Sep) >28150 @ $75 (6 Contracts)  Max Risk: $150  Max Reward $450

      The Opening Bell was working against me, and then, sure enough, the bottom dropped out.

      In just over an hour, most of my trades were up big, resulting in a $1,410 available profit out of a maximum total of $1,800 available.

      With 5 hours remaining in the trading day, I opted to cash out. In just a few hours, I was able to recoup almost all of the losses from the previous day.

      4:15 Daily Expiry Values

      SELL US 500 (Sep) >3428 Closed at 3418  Max Reward $450 would have been achieved.
      SELL US SmallCap 2000 >1541.0 Closed at 1531.5  Max Reward $450 would have been achieved
      SELL US Tech 100 (Sep) >11608 Closed at 11550  Max Reward $450 would have been achieved
      SELL Wall St. 30 (Sep) >28150  Closed at 28070  Max Reward $450 would have been achieved