Showing posts with label Futures. Show all posts

Monday, July 27, 2020

Weekly Nadex Commentary - August 27-31


Will  Gold Hit $2,000 this Week?

Weekly Bias:
  • Gold: Bullish
  • EUR/USD: Bullish
  • GBP/USD: Bullish
  • USD/JPY: Bearish
  • USD/CHF: Bearish


The markets closed below the T-Line last week, signalling a potential downturn in the market after an extended run-up. The US Stock indices are too flat right now to call a reversal or signal a continued run to the upside. My bias is neutral for now.

Gold, on the other hand, is continuing it's run toward $2,000. As of Monday morning, Gold was trading around $1,940, if it continues its upward trajectory, it's quite possible that the elusive $2,000 target could be hit this week.


Gold prices are traveling on a very steep uptrend, and showing no sign of reversal.

Last week, we had a bullish outlook on Gold, and I see no reason to buck the trend. My opinion on Gold is Bullish. 

When the markets opened Monday Morning, Gold was traveling around $1,966 before dipping around mid morning.

Using Nadex as my guide, I formulated the following opinion:

Gold prices will settle above $1,996.50 by Friday at 1:30pm ET when the Gold Markets close.

Click on Charts to Enlarge

So I clicked on the Weekly Binary Options contracts for Gold, and selected the > 1966.5 Strike Price. Here are the contract details:
Contract: BUY  Gold (Dec) >1966.5
Contract Expiry: Weekly: Expires on Friday, July 31 at 1:30PM ET
Number of Contracts: 5
Price: $43.8
Maximum Risk: $43.80 per contract traded = $219 (plus exchange fees)
Maximum Reward: $56.20 per contract traded = $281 (less exchange fees)

I will monitor this trade throughout the week, and publish trade results..

Trade Results

With over four days remaining in this trade, I have three options:
  1. Take an Early Profit - If Gold prices continue to skyrocket upward, I can opt to exit the trade and lock in profits. Nothing wrong with that.
  2. Exit Early to Minimize Losses - If the trade moves sharply against me, I can also exit the trade to minimize losses. I might consider this if my losses hover around 50 percent of capital risked (-$110)
  3. Set it and Forget it - Let the trade ride until Expiration. - I'm okay with losing $219 if the trade goes against me. This uptrend looks good. I'm all in for a $281 reward. Come on, Gold at $2,000!
Update: Tuesday, July 28

In the overnight hours, Gold briefly touched $2,000, and then got "Monkeyhammered", according to a tweet from Zerohedge.


On Tuesday morning, Gold started to rebound. The question is whether Gold will re-test the 2,000 level or whether it will sell-off from current levels.

When I grabbed my screen shot this morning, this trade was down $110, right at where I was considering stopping-out. As I continue to update this post the trade is now down only $49.

There are over 3 days remaining in this trade. I'm going to stay in and see what happens for the meantime.

Tuesday, July 28 - Trade Exited for Modest Profit of $80


In a discussion with Stephen Bigalow about this trade, Steve pointed out that a long-legged Doji had formed in overbought territory, signalling a potential reversal in Gold.

This trade was already up $80, out of the maximum $281 reward possible. In this trade, I opted to exit the trade and lock in a sure profit.

Try Nadex Today, Risk-Free

What I like about Nadex the most is that every trade has capped risk that is known in advance before you place your trade. That's huge in these days of extreme market volatility. It's impossible for a trade to run away from you. No margin calls.

If you're curious about trading with Nadex, download their free demo here. Your account will be funded with $10,000 in play money and you can practice trading with defined risk.

You can fund a Nadex account for as little as $250. Nadex is available for traders in 41 countries.

Thursday, August 13, 2015

A Low Risk, High-Reward Twist on the DAX "Strudel" Strategy with Nadex


Every morning, I trade the the 7am-9am Germany 30 (DAX) strategy with Nadex binary options. I call it the "Strudel" strategy, because it's a delicious breakfast trade. This strategy was based on the observation from Tom Busby, a veteran Futures trader who observed that the 7am EDT hourly candlestick of the Germany 30 (DAX) Index is a pivot point that determines the direction of that market for the following hour a great majority of the time.

The rules for the strategy are remarkably simple:

  • Select the 7am-9am EST Nadex time period for the Germany 30 (DAX) Index.
  • Once you are 100% convinced that the 7am EDT hourly candlestick will be  BULLISH, then BUY at the first Nadex strike price available BELOW the opening price of hourly candlestick.
  • Once you are 100% convinced that the 7am EDT hourly candlestick will BEARISH, then SELL at the first Nadex strike price available ABOVE the opening price of hourly candlestick.
  • The safest way to execute this strategy is to wait for the 7am hourly candlestick to completely close before you make a decision to BUY or SELL. Markets can get whippy, and one of the most common mistakes made with this strategy is to pull the trigger too early on the trade. Patience is key.


This strategy has been remarkably consistent. Over the past 60+ trading days, this pattern has repeated itself about 90 percent of the time. Just be patient and watch the 7am hourly candlestick develop. Once it's confirmed bullish, then buy. If it's confirmed bearish, then sell. Again, if you want to be "super-safe", don't make a trading decision until 8am, after the 7am hourly candlestick has closed.
Sometimes the 7am hourly candlestick develops very bullish or bearish in a hurry. When that happens, it may be very difficult to get a trade that satisfies your risk/reward criteria. Today was an example of such a trade.


5 Minute Nadex Chart on the Germany 30 (DAX) Index. Click on Chart to Enlarge.

Looking at the chart above, the market had been on an extended downtrend, opening at 11422 at 7:00am EDT. The market ground it's way upward for the first 15 minutes. Then it reversed and started to dive. The 7am hourly candlestick closed at 11405 - BEARISH.

Under the trading rules of this strategy, that would trigger a SELL from 11429, the first Nadex strike price ABOVE the 7am hourly candlestick. But at 8:00am the market was 25 ticks away from the strike price and continuing to move South. To get an order filled, it would have required me to risk $85-$90 per contract. A little bit too expensive for me.  The MACD was starting to cross over from bullish to bearish, and I felt the downtrend would continue, so I placed two orders: 


The first order was a working order that satisfied the rules of the trade. I sold from the first strike price ABOVE the 7am hourly closed candle, which was 11429. The market looked like it was going to be on a continuation down trend, so I placed another live order to SELL at 11369. For this order to settle in-the-money (ITM) for full profit, the market would need to drop another 36 ticks.

The beauty of out-of-the-money (OTM) trades is that your capital risked is far less than your potential reward. But OTM trades also become valuable when the market starts to move toward your strike price. I had a $30 profit target per contract with my pending order. I also decided on a $30 profit target for my live order.

It looked like the market wasn't going to cooperate with my OTM trade, but I only had $8 risked. Then at 8:55, just 5 minutes before the trade was due to expire, the market dove. My trade was now worth $31 in profit, so I took profit and closed out the trade. Mission accomplished. I hit my profit target.

The market expired below 11369. If I had decided not to exit the trade, I could have picked up $92 instead of $31.  But that wasn't a certainty. As sharply as the market dropped, it could have easily retraced and settled above 11369 at the 9:00am expiration.


The first trade never filled, so there was no trade on my SELL at 11429 with a $30 profit target. Instead I managed to pick up the $30 profit risking only $8 instead of $70.  It was a slightly different twist on my normal strategy, but yielded the same results.


Free Nadex Education Reminder:


  • Thursday, August 13 Advanced Trading Strategies (Part Two) 8pm EST  Register Here

Try this Strategy on a Free, 2-Week Nadex Demo Account!
Nadex is available to trade in 47 countries!

Video: Breakfast, Lunch & Dinner Trades with Nadex
By Cam White, TradingPub


The Purpose of this Blog


The Inquisitive Trader will be used  to share my experiences as an investor getting back into trading the markets. In June 2014 I joined the staff at TradingPub, and I am responsible for helping to book speakers for free webinars. Each week, I am exposed to a wealth of information from leading industry experts who teach how to trade the financial markets. When I come across interesting trading strategies, I will summarize my thoughts and share a link to the archived webinar. As I develop my own trading plan, I will also share some of my personal successes and failures. Responsible comments are welcome, but to avoid flaming posts and spam, I will be moderating all comments. I hope you find this blog useful, and wish you the very best on your journey trading the markets.

Disclaimer

The opinions expressed in this blog are solely those of the author, and should not be construed as trading advice. I am not a registered or certified financial planner. There is a very high degree of risk involved in trading. Past results are not indicative of future returns. All individuals affiliated with this site assume no responsibilities for your trading and investment results. The indicators, strategies, columns, articles and all other features are for educational purposes only and should not be construed as investment advice. Information for futures trading observations are obtained from sources believed to be reliable, but we do not warrant its completeness or accuracy, or warrant any results from the use of the information. Your use of the trading observations is entirely at your own risk and it is your sole responsibility to evaluate the accuracy, completeness and usefulness of the information. You must assess the risk of any trade with your broker and make your own independent decisions regarding any securities mentioned herein.

Monday, August 10, 2015

A Lunchtime "Pastrami" Trade on the S&P 500 with Nadex Binary Options


When I think about lunch time on Wall Street, I think of a Pastrami on Rye at a New York Deli. With that in mind, I recently came across a lunch time trade that looks like it could be quite tasty. In honor of lunch time in New York, I am calling this trade the "Pastrami".

A few weeks ago, I was doing some monthly analysis on some of my other favorite trading strategies, when I noticed a very consistent pattern that revealed itself on the S&P 500 Futures market.


Looking at the hourly charts, something jumped out at me. It appeared that the 11:00am EDT hourly candlestick controlled the 12:00pm EDT hourly candlestick with a high degree of frequency. 

Here's what I saw:


Hourly Chart of S&P 500 Futures (Investing.com)  Click on Chart to Enlarge.
Notice the 11am hourly candlesticks above. Can you see that the following 12pm candlestick never challenges the opening price of the 11am candlestick? In fact, the 12pm candlestick tends to continue in the same direction that was established by the 11am candlestick. I back-tested the hourly charts on Investing.com charts for 40 trading days, and the same pattern repeated itself for 36 out of 40 days. That's a 90% probability of a pattern repeating itself. 

The same phenomenon occurs with the 7am-9am German "Strudel" strategy that I have written about extensively. Complete rules for the "Strudel" strategy are included in the free eBook from TradingPub, entitled "Trading Made Simple: Strategies that Risk $100 or Less".

The rules for this new "Pastrami" strategy are very simple to execute:


  • Select the 11am-1pm EST Nadex time period for the US 500 Index on the Nadex platform.
  • Once you are 100% convinced that the 11:00am EDT hourly candlestick is BULLISH, then BUY at the first Nadex strike price available BELOW the opening price of the 11am hourly candlestick.
  • Once you are 100% convinced that the hourly candlestick is BEARISH, then SELL at the first Nadex strike price available ABOVE the opening price of the 11am hourly candlestick.
This is a very simple strategy that looks like it can be fairly consistent. Just be patient and watch the 11am hourly candlestick develop. Once it's confirmed bullish, then buy. If it's confirmed bearish, then sell. If you want to be "super-safe", don't make a trading decision until 12pm, after the 11am hourly candlestick has completely closed.

I have taken several trades with this strategy in demo, and I like what I'm seeing thus far. I don't always get filled with my risk/reward rules, but it's rare for a trade to threaten me once I'm in the market. I know that I have a recent 90 percent historical probability of my trade expiring in the money for full profit. That also means I have a 10 percent probability of losing the trade. As long as I risk $80 or less on each trade (my preference is $70 risk), I know that it's very hard to lose money.

Let's take a look at a recent "Pastrami" Trade (Friday, July 31  2015) taken in my Demo Account:

Hourly Nadex Chart on the US 500 Index (Click on Chart to Enlarge)
After three very choppy hours of trading, the 11am hourly candlestick was a battle between the bulls and the bears. Notice the wicks above and below the 11am candlestick. Ultimately, the bears won by a small margin.

Knowing that I had a 90% probability of this trade working out in my favor if I SOLD from ABOVE the opening price of the 11am candlestick, I placed the two trades at 12:13pm, after the close of the first hour of trading. I decided to wait on confirmation of the direction of the 12:00 hourly candlestick, since the 11am hourly candlestick was almost a Doji.


The first trade was placed at the very first strike price above the  11am hourly candlestick. Since the market was trading in that area, I was able to place an at-the-money (ATM) SELL trade at 2106.3, risking $50 to make $50. But since I knew the odds were heavily in my favor for the 12pm hourly candlestick to be bearish, I also took an in-the-money (ITM) SELL trade at 2107.8, risking $71.75 per contract to make $28.25.

Both of my trades were briefly threatened by an uptick in the market, before it reversed and dove until the 1pm expiration of the trade. The market settled at 2104.50, comfortably below my SELL strike prices at 2106.3 and 2107.8 for a full profit on both propositions.

Conclusion:

This is a new trading observation, and it needs further back-testing. I have only looked at 40 trading days, but need to go back further to see if this pattern holds up to the test of time.

Here's how the Pastrami trade played out over 20 consecutive trading days in July, assuming you placed a trade at the close of the 11am hourly candlestick, risking $70 per contract:
  • Pattern Success: The 12pm hourly candlestick did not violate the trade strike price in 19 out of 20 trades. That's a 95% success rate for the actual pattern.
  • Trades Filled and Won at  $70 Risk: 9 trades won and settled ITM for a full $30 profit per contract. That's a $270 gain.
  • Trades Filled and Lost at  $70 Risk: 1 trade lost and settled OTM for a maximum $70 loss.
  • No-Fills: 10 trades resulted in no-fills at $70 risk. The market had moved too far in the 11am hour to get my preferred $70 risk/reward at 12pm. If you waited for the candle to close you wouldn't have had a trade. No harm, no foul.
  • End Result: The traded would have yielded a net profit of $200, if you took a full loss on the 1 losing trade, and let your 9 winners ride until expiration.Your exchange fees would have totaled $17.10 for a net profit of $182.90. If you traded with a $1,000 opening account balance, this strategy alone would have yielded an 18.9 percent return for July.
And that will buy a few Pastrami sandwiches.  I will continue to record daily results on this strategy for the months going forward, and will post the results. I will also be looking for OTM and Nadex Spread opportunities with this trade.


Try this Strategy Out for Yourself. Download a 2 Week Nadex Demo.
Nadex is now available for trading in 47 countries. You will have complete access to the Nadex trading platform, and your demo account will be funded with $25,000 in play money.

Free Nadex Education Reminder:


  • Monday, August 10 Basics of Nadex Spreads 7pm EST  Register Here

To see how I trade these strategies in the live markets, click below:


The Purpose of this Blog


The Inquisitive Trader will be used  to share my experiences as an investor getting back into trading the markets. In June 2014 I joined the staff at TradingPub, and I am responsible for helping to book speakers for free webinars. Each week, I am exposed to a wealth of information from leading industry experts who teach how to trade the financial markets. When I come across interesting trading strategies, I will summarize my thoughts and share a link to the archived webinar. As I develop my own trading plan, I will also share some of my personal successes and failures. Responsible comments are welcome, but to avoid flaming posts and spam, I will be moderating all comments. I hope you find this blog useful, and wish you the very best on your journey trading the markets.

Disclaimer

The opinions expressed in this blog are solely those of the author, and should not be construed as trading advice. I am not a registered or certified financial planner. There is a very high degree of risk involved in trading. Past results are not indicative of future returns. All individuals affiliated with this site assume no responsibilities for your trading and investment results. The indicators, strategies, columns, articles and all other features are for educational purposes only and should not be construed as investment advice. Information for futures trading observations are obtained from sources believed to be reliable, but we do not warrant its completeness or accuracy, or warrant any results from the use of the information. Your use of the trading observations is entirely at your own risk and it is your sole responsibility to evaluate the accuracy, completeness and usefulness of the information. You must assess the risk of any trade with your broker and make your own independent decisions regarding any securities mentioned herein.

Tuesday, July 14, 2015

Patience Pays Off with the Nadex "Strudel" Strategy on the DAX Index


Every morning, I trade the the 7am-9am Germany 30 (DAX) strategy with Nadex binary options. I call it the "Strudel" strategy, because it's a delicious breakfast trade. This strategy was based on the observation from Tom Busby, a veteran Futures trader who observed that the 7am EST hourly candlestick of the Germany 30 (DAX) Index is a pivot point that determines the direction of that market for the following hour a great majority of the time.

The rules for the strategy are remarkably simple:

  • Select the 7am-9am EST Nadex time period for the Germany 30 (DAX) Index.
  • If the 7am EST hourly candlestick is BULLISH, then BUY at the first Nadex strike price available BELOW the opening price of hourly candlestick.
  • If the 7am EST hourly candlestick is BEARISH, then SELL at the first Nadex strike price available ABOVE the opening price of hourly candlestick.
This strategy has been remarkably consistent. Over the past 60+ trading days, this pattern has repeated itself about 90 percent of the time. Just be patient and watch the 7am hourly candlestick develop. Once it's confirmed bullish, then buy. If it's confirmed bearish, then sell. If you want to be "super-safe", don't make a trading decision until 8am, after the 7am hourly candlestick has closed.

But a key word with this strategy is patience. One of the biggest mistakes traders make with this strategy is to jump the gun and pull the trigger too early on this strategy. Let's take a look at this 15-minute Nadex chart:

15 minute Nadex Chart on the Germany 30 (DAX) Index. Click on Chart to Enlarge.
The first 2 15-minute candles at the 7am open are bullish. The market had been riding a downtrend, but appeared to be reversing. It was riding above the 8 EMA and the MACD just crossed over from bearish to bullish. For many, it would be easy to assume that the hourly candlestick would close bullish, triggering a BUY.
But now let's take a look how the first hour of trading played out on the hourly charts:

Hourly Nadex Chart. Click to Enlarge

On the hourly charts, you can see that the market was on a steep downtrend. The bullish move on the 15-minute charts above was simply a retracement back to the 8 EMA, before the market continued it's downward path. The hourly candlestick closed BEARISH, triggering a SELL from the first Nadex strike price ABOVE the opening price.

But a little more patience was warranted. At 8:30am, several economic news reports (Retail Sales)  were due to be released. The decision was made to sit on the sidelines and wait for the reports to be released befor placing my SELL order. At 8:30, the econ news was released:


Econ News courtesy of Investing.com
As you can see the news was bearish, and the market dove. I quickly placed a SELL order, risking $80.75 to make $19.25. That may not sound like much reward, but I felt highly confident that this trade would expire successfully with little stress. And it did. Here's how the trade played out:
5 Minute Nadex Charts. Click on Chart to Enlarge
On this 5 minute chart, you can see how the market was bullish in the first half hour, before diving and turning bearish. At 8:30, you can see how the economic news affected the market. The SELL order was a high risk, low reward trade, but it was never threatened. It was a quick $19.25 per contract trade, less $1.80 in exchange fees.

And that will buy a Strudel.

Free Nadex Education Reminder:


Curious about Nadex? Open a Free, 2-Week Nadex Demo Account!
Nadex is available to trade in 24 countries!

Video: Breakfast, Lunch & Dinner Trades with Nadex
By Cam White, TradingPub


The Purpose of this Blog


The Inquisitive Trader will be used  to share my experiences as an investor getting back into trading the markets. In June 2014 I joined the staff at TradingPub, and I am responsible for helping to book speakers for free webinars. Each week, I am exposed to a wealth of information from leading industry experts who teach how to trade the financial markets. When I come across interesting trading strategies, I will summarize my thoughts and share a link to the archived webinar. As I develop my own trading plan, I will also share some of my personal successes and failures. Responsible comments are welcome, but to avoid flaming posts and spam, I will be moderating all comments. I hope you find this blog useful, and wish you the very best on your journey trading the markets.

Disclaimer

The opinions expressed in this blog are solely those of the author, and should not be construed as trading advice. I am not a registered or certified financial planner. There is a very high degree of risk involved in trading. Past results are not indicative of future returns. All individuals affiliated with this site assume no responsibilities for your trading and investment results. The indicators, strategies, columns, articles and all other features are for educational purposes only and should not be construed as investment advice. Information for futures trading observations are obtained from sources believed to be reliable, but we do not warrant its completeness or accuracy, or warrant any results from the use of the information. Your use of the trading observations is entirely at your own risk and it is your sole responsibility to evaluate the accuracy, completeness and usefulness of the information. You must assess the risk of any trade with your broker and make your own independent decisions regarding any securities mentioned herein.

Thursday, July 9, 2015

Trusting the Probabilities on a Nadex FTSE 100 Strategy


Today's Nadex trade for the FTSE 100 Index required trusting a key indicator along with historical probabilities of success for a strategy that has been backtested for several months. The FTSE100 is an index of the top 100 companies traded on the London Exchange.

Over the past 62 trading days, the FTSE 100 has displayed a pattern between 9am-11am EDT that has repeated itself 47 out of 62 times, or slightly better than 75 percent of the time. If you followed the rules of this strategy, and got in on every trade, then your trade would have expired successfully 47 out of 62 times.

Today, it looked like an exception to the rule was coming into play. The setup looked dangerous, and the trade required patience for the right entry.

But first, here are the rules for the 9am-11am FTSE 100 "Footsie" Strategy:


Click on Nadex Chart to Enlarge
Notice the 9am hourly candlesticks above. Can you see that the following 10am candlestick never challenges the opening price of the 9am candlestick? In fact, the 10am candlestick tends to continue in the same direction that was established by the 9am candlestick. To back test this, simply pull up the hourly charts of the FTSE 100 on Investing.com and go back 60 days. Compare the 9am EDT hourly candlestick  to the 10am hourly candlestick. You will see how frequently this pattern repeats itself.

The same phenomenon occurs with the 7am-9am German "Strudel" strategy that I have written about extensively. Complete rules for the "Strudel" strategy are included in the free eBook from TradingPub, entitled "Trading Made Simple: Strategies that Risk $100 or Less".

The rules for this new strategy are very simple to execute:


  • Select the 9am-11am EST Nadex time period for the FTSE 100 Index.
  • If the 9am EST hourly candlestick is BULLISH, then BUY at the first Nadex strike price available BELOW the opening price of the 9am hourly candlestick.
  • If the 9am EST hourly candlestick is BEARISH, then SELL at the first Nadex strike price available ABOVE the opening price of the 9am hourly candlestick.
This strategy has been very consistent over the past 3 months. Just be patient and watch the 9am hourly candlestick develop. Once it's confirmed bullish, then buy. If it's confirmed bearish, then sell. If you want to be "super-safe", don't make a trading decision until 10am, after the 9am hourly candlestick has closed.

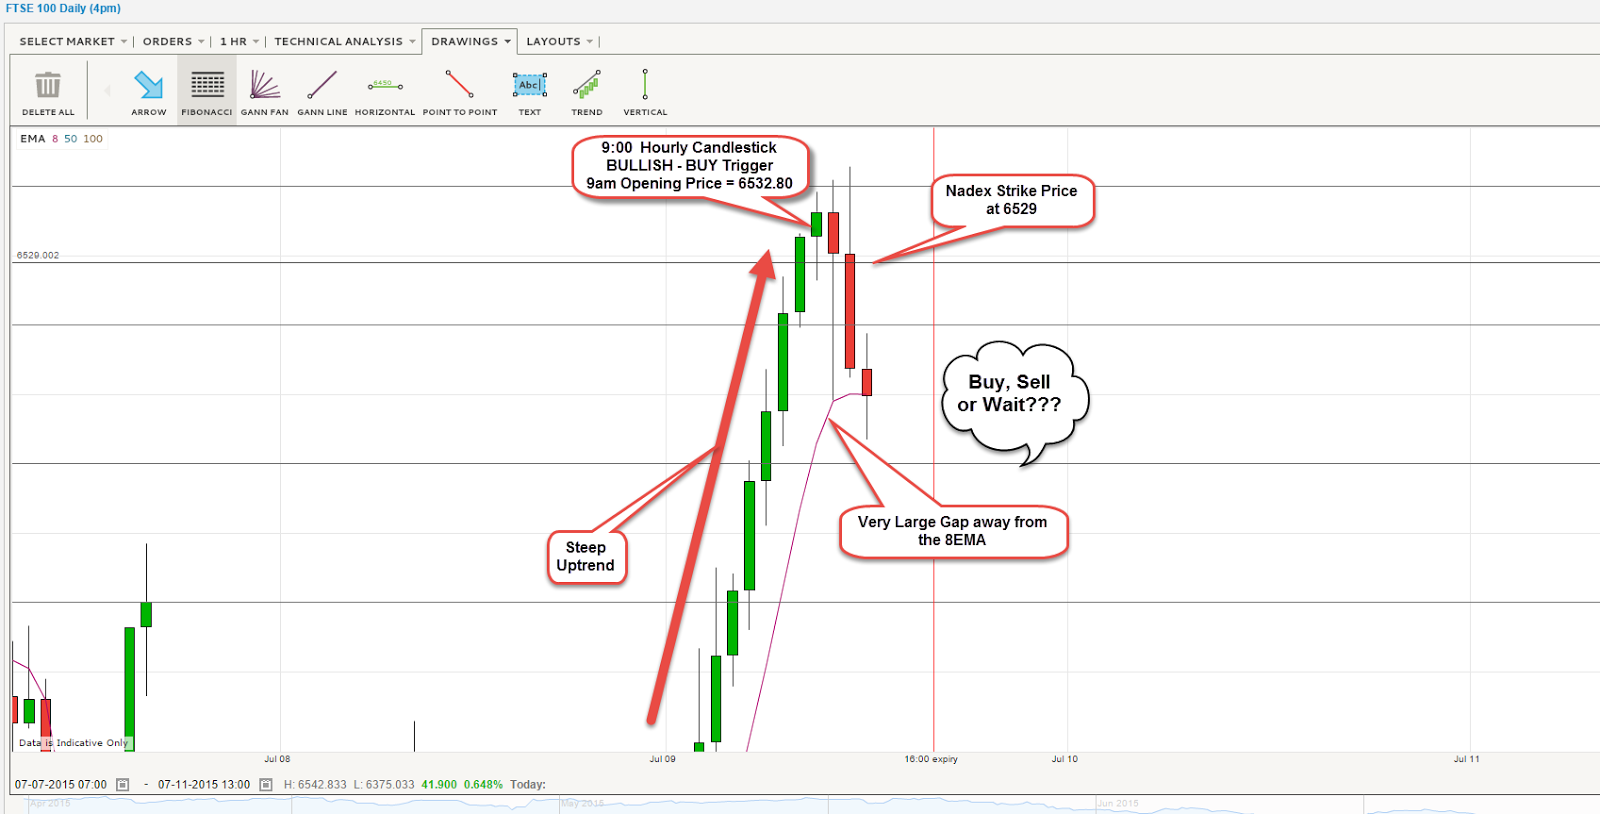
Trading this strategy today required patience and caution, as the chart below illustrates:

Nadex Hourly Chart of the FTSE 100 Index. Click on Chart to Enlarge

The FTSE 100 Index had been riding a very steep uptrend for 7 consecutive hours going into the 9am hour. The 9am hourly candlestick was also developing bullish, but it was also gapping significantly away from the 8 EMA indicator. When the market gaps away from the 8 EMA (also known as the "T-Line") it almost always has to come back. It's like a rubber band. You can pull the market away from the 8 EMA, but it always snaps back.

With a bullish 9am hourly candle, it would normally automatically trigger a BUY at the first strike price below the 9am open. But I didn't like how far the market had gapped away from the 8EMA, and I sensed it would snap back with a vengeance. So I decided to sit on the sidelines and wait to see what the market would do.

Sure enough, the market snapped back with a vengeance. It blew through the strike price, and kept going all of the way down until it touched the 8 EMA.

So now I had a decision to make. Will the market reverse direction and head back north, and settle above the 1st strike price below the 9am open? With 40 minute left in the trade, it sure didn't look like it. But I reminded myself that this strategy has a 75% success rate, and a reversal looked like it was imminent. If I placed that trade, it was an Out-of-the-money trade, risking only $30 to make $70 per contract. Low risk, high reward. I pulled the trigger and went for it. Here's how the trade played out.

5 Minute Nadex Chart. Click on Chart to Enlarge

From 10am-10:30, the market kept going downward until it touched the 8EMA on the Hourly charts. Then it abruptly reversed and headed straight up, expiring for a full profit of $70 per contract, less $1.80 in exchange fees.


Conclusion:

In hindsight, this was a trade I probably should have passed on.  It wound up working out exactly as I had predicted, but it could have easily lost. The market had to dive sharply toward the 8 EMA, and then bounce back up. I also had to have confidence in the recent historical probability of success. Those were two variables I had to trust before I pulled the trigger. But since I was only risking $30 per contract for a potential $70 reward, I wasn't too nervous.


Try this Strategy Out for Yourself. Download a 2 Week Nadex Demo.
Nadex is now available for trading in 47 countries. You will have complete access to the Nadex trading platform, and your demo account will be funded with $25,000 in play money.

Free Nadex Education Reminder:


  • Thursday, July 9  Introduction to Binary Options 9pm EST Register Here
  • For the full Calendar of July Nadex Educational events, click here


To view a other high-probability Nadex trading strategies, click below:


The Purpose of this Blog


The Inquisitive Trader will be used  to share my experiences as an investor getting back into trading the markets. In June 2014 I joined the staff at TradingPub, and I am responsible for helping to book speakers for free webinars. Each week, I am exposed to a wealth of information from leading industry experts who teach how to trade the financial markets. When I come across interesting trading strategies, I will summarize my thoughts and share a link to the archived webinar. As I develop my own trading plan, I will also share some of my personal successes and failures. Responsible comments are welcome, but to avoid flaming posts and spam, I will be moderating all comments. I hope you find this blog useful, and wish you the very best on your journey trading the markets.

Disclaimer

The opinions expressed in this blog are solely those of the author, and should not be construed as trading advice. I am not a registered or certified financial planner. There is a very high degree of risk involved in trading. Past results are not indicative of future returns. All individuals affiliated with this site assume no responsibilities for your trading and investment results. The indicators, strategies, columns, articles and all other features are for educational purposes only and should not be construed as investment advice. Information for futures trading observations are obtained from sources believed to be reliable, but we do not warrant its completeness or accuracy, or warrant any results from the use of the information. Your use of the trading observations is entirely at your own risk and it is your sole responsibility to evaluate the accuracy, completeness and usefulness of the information. You must assess the risk of any trade with your broker and make your own independent decisions regarding any securities mentioned herein.

Friday, June 19, 2015

An After Dinner Trade on the Nikkei 225 with Nadex


If you are busy working during the daytime, and can't watch the markets, here is a trading strategy that could yield consistent trading results after dinner.

Early yesterday evening, I was browsing through the Nadex trading platform, and I decided to take a look at some markets that I rarely trade. I pulled up the Japan 225 (Nikkei) index, and started to look at the historical performance of that index on multiple time frames to see if any patterns emerged.


When I switched to the hourly charts, something jumped out at me. It appeared that the 8pm EDT hourly candlestick controlled the 9pm EDT candlestick with a high degree of frequency. 

Here's what I saw:


Click on Chart to Enlarge
Notice the 8pm hourly candlesticks above. Can you see that the following 9pm candlestick never challenges the opening price of the 8pm candlestick? In fact, the 9pm candlestick tends to continue in the same direction that was established by the 8pm candlestick. I back-tested the hourly charts on Nadex, and the same pattern repeated itself for 10 consecutive trading days. Then I switched to the Nikkei feed on Investing.com and continued back-testing through mid-April. The pattern held about 85-90 percent of the time.

The same phenomenon occurs with the 7am-9am German "Strudel" strategy that I have written about extensively. Complete rules for the "Strudel" strategy are included in the free eBook from TradingPub, entitled "Trading Made Simple: Strategies that Risk $100 or Less".

The rules for this new strategy are very simple to execute:


  • Select the 8pm-10pm EST Nadex time period for the Japan 225 (Nikkei) Index.
  • If the 8pm EST hourly candlestick is BULLISH, then BUY at the first Nadex strike price available BELOW the opening price of hourly candlestick.
  • If the 8pm EST hourly candlestick is BEARISH, then SELL at the first Nadex strike price available ABOVE the opening price of hourly candlestick.
This is a very simple strategy that looks like it can be remarkably consistent. Just be patient and watch the 8pm hourly candlestick develop. Once it's confirmed bullish, then buy. If it's confirmed bearish, then sell. If you want to be "super-safe", don't make a trading decision until 9pm, after the 8pm hourly candlestick has closed.

Since this is the first time I have traded on this observation, I elected to trade in demo, and here is how the traded played out:

Click on the chart to Enlarge

8:00pm - The 8pm hourly candlestick opened at 20114.667, and drove downward for 30 minutes. Convinced that the market was going to continue on its bearish path, a pending/working order was placed to SELL from the first strike price available ABOVE the 8pm opening price. 2 trades were placed:


These were not a market orders. For both of them to fill, the market would have to grind back upward for a fill. Sure enough the market reversed and ground its way upward, filling both orders.

9:00pm - The 8pm hourly candlestick closed BEARISH at 20115.000.  For both orders to expire successfully in the money, the Japan 225 market need to close at or below 20140 by the 10 pm expiration.  The market ground back upward, threatening my SELL order at >20140. It ultimately came back down and settled at  exactly 20140. A little too close for comfort, but a successful trade nonetheless.

Trade Results:


Win: SELL at >20180 - 4 contracts x $20 profit,  less $7.20 in exchange fees = $72.80
Win: SELL at >20140 - 1 contract x $43.50 profit, less $1.80 in exchange fees = $41.70
Total Profit after fees: $114.50


Conclusion:

This is a new trading observation. I have back-tested as far back as I can get a feed from Investing.com. Over the past 2 months, the results look promising. I will continue to demo this a few more times to see if the strategy needs tweaking, and will continue to record and report results.


Try this Strategy Out for Yourself. Download a 2 Week Nadex Demo.
Nadex is now available for trading in 47 countries. You will have complete access to the Nadex trading platform, and your demo account will be funded with $25,000 in play money.

Free Nadex Education Reminder:


To view a other high-probability Nadex trading strategies, click below:


The Purpose of this Blog


The Inquisitive Trader will be used  to share my experiences as an investor getting back into trading the markets. In June 2014 I joined the staff at TradingPub, and I am responsible for helping to book speakers for free webinars. Each week, I am exposed to a wealth of information from leading industry experts who teach how to trade the financial markets. When I come across interesting trading strategies, I will summarize my thoughts and share a link to the archived webinar. As I develop my own trading plan, I will also share some of my personal successes and failures. Responsible comments are welcome, but to avoid flaming posts and spam, I will be moderating all comments. I hope you find this blog useful, and wish you the very best on your journey trading the markets.

Disclaimer

The opinions expressed in this blog are solely those of the author, and should not be construed as trading advice. I am not a registered or certified financial planner. There is a very high degree of risk involved in trading. Past results are not indicative of future returns. All individuals affiliated with this site assume no responsibilities for your trading and investment results. The indicators, strategies, columns, articles and all other features are for educational purposes only and should not be construed as investment advice. Information for futures trading observations are obtained from sources believed to be reliable, but we do not warrant its completeness or accuracy, or warrant any results from the use of the information. Your use of the trading observations is entirely at your own risk and it is your sole responsibility to evaluate the accuracy, completeness and usefulness of the information. You must assess the risk of any trade with your broker and make your own independent decisions regarding any securities mentioned herein.