Showing posts with label SP500. Show all posts

Monday, August 10, 2015

A Lunchtime "Pastrami" Trade on the S&P 500 with Nadex Binary Options


When I think about lunch time on Wall Street, I think of a Pastrami on Rye at a New York Deli. With that in mind, I recently came across a lunch time trade that looks like it could be quite tasty. In honor of lunch time in New York, I am calling this trade the "Pastrami".

A few weeks ago, I was doing some monthly analysis on some of my other favorite trading strategies, when I noticed a very consistent pattern that revealed itself on the S&P 500 Futures market.


Looking at the hourly charts, something jumped out at me. It appeared that the 11:00am EDT hourly candlestick controlled the 12:00pm EDT hourly candlestick with a high degree of frequency. 

Here's what I saw:


Hourly Chart of S&P 500 Futures (Investing.com)  Click on Chart to Enlarge.
Notice the 11am hourly candlesticks above. Can you see that the following 12pm candlestick never challenges the opening price of the 11am candlestick? In fact, the 12pm candlestick tends to continue in the same direction that was established by the 11am candlestick. I back-tested the hourly charts on Investing.com charts for 40 trading days, and the same pattern repeated itself for 36 out of 40 days. That's a 90% probability of a pattern repeating itself. 

The same phenomenon occurs with the 7am-9am German "Strudel" strategy that I have written about extensively. Complete rules for the "Strudel" strategy are included in the free eBook from TradingPub, entitled "Trading Made Simple: Strategies that Risk $100 or Less".

The rules for this new "Pastrami" strategy are very simple to execute:


  • Select the 11am-1pm EST Nadex time period for the US 500 Index on the Nadex platform.
  • Once you are 100% convinced that the 11:00am EDT hourly candlestick is BULLISH, then BUY at the first Nadex strike price available BELOW the opening price of the 11am hourly candlestick.
  • Once you are 100% convinced that the hourly candlestick is BEARISH, then SELL at the first Nadex strike price available ABOVE the opening price of the 11am hourly candlestick.
This is a very simple strategy that looks like it can be fairly consistent. Just be patient and watch the 11am hourly candlestick develop. Once it's confirmed bullish, then buy. If it's confirmed bearish, then sell. If you want to be "super-safe", don't make a trading decision until 12pm, after the 11am hourly candlestick has completely closed.

I have taken several trades with this strategy in demo, and I like what I'm seeing thus far. I don't always get filled with my risk/reward rules, but it's rare for a trade to threaten me once I'm in the market. I know that I have a recent 90 percent historical probability of my trade expiring in the money for full profit. That also means I have a 10 percent probability of losing the trade. As long as I risk $80 or less on each trade (my preference is $70 risk), I know that it's very hard to lose money.

Let's take a look at a recent "Pastrami" Trade (Friday, July 31  2015) taken in my Demo Account:

Hourly Nadex Chart on the US 500 Index (Click on Chart to Enlarge)
After three very choppy hours of trading, the 11am hourly candlestick was a battle between the bulls and the bears. Notice the wicks above and below the 11am candlestick. Ultimately, the bears won by a small margin.

Knowing that I had a 90% probability of this trade working out in my favor if I SOLD from ABOVE the opening price of the 11am candlestick, I placed the two trades at 12:13pm, after the close of the first hour of trading. I decided to wait on confirmation of the direction of the 12:00 hourly candlestick, since the 11am hourly candlestick was almost a Doji.


The first trade was placed at the very first strike price above the  11am hourly candlestick. Since the market was trading in that area, I was able to place an at-the-money (ATM) SELL trade at 2106.3, risking $50 to make $50. But since I knew the odds were heavily in my favor for the 12pm hourly candlestick to be bearish, I also took an in-the-money (ITM) SELL trade at 2107.8, risking $71.75 per contract to make $28.25.

Both of my trades were briefly threatened by an uptick in the market, before it reversed and dove until the 1pm expiration of the trade. The market settled at 2104.50, comfortably below my SELL strike prices at 2106.3 and 2107.8 for a full profit on both propositions.

Conclusion:

This is a new trading observation, and it needs further back-testing. I have only looked at 40 trading days, but need to go back further to see if this pattern holds up to the test of time.

Here's how the Pastrami trade played out over 20 consecutive trading days in July, assuming you placed a trade at the close of the 11am hourly candlestick, risking $70 per contract:
  • Pattern Success: The 12pm hourly candlestick did not violate the trade strike price in 19 out of 20 trades. That's a 95% success rate for the actual pattern.
  • Trades Filled and Won at  $70 Risk: 9 trades won and settled ITM for a full $30 profit per contract. That's a $270 gain.
  • Trades Filled and Lost at  $70 Risk: 1 trade lost and settled OTM for a maximum $70 loss.
  • No-Fills: 10 trades resulted in no-fills at $70 risk. The market had moved too far in the 11am hour to get my preferred $70 risk/reward at 12pm. If you waited for the candle to close you wouldn't have had a trade. No harm, no foul.
  • End Result: The traded would have yielded a net profit of $200, if you took a full loss on the 1 losing trade, and let your 9 winners ride until expiration.Your exchange fees would have totaled $17.10 for a net profit of $182.90. If you traded with a $1,000 opening account balance, this strategy alone would have yielded an 18.9 percent return for July.
And that will buy a few Pastrami sandwiches.  I will continue to record daily results on this strategy for the months going forward, and will post the results. I will also be looking for OTM and Nadex Spread opportunities with this trade.


Try this Strategy Out for Yourself. Download a 2 Week Nadex Demo.
Nadex is now available for trading in 47 countries. You will have complete access to the Nadex trading platform, and your demo account will be funded with $25,000 in play money.

Free Nadex Education Reminder:


  • Monday, August 10 Basics of Nadex Spreads 7pm EST  Register Here

To see how I trade these strategies in the live markets, click below:


The Purpose of this Blog


The Inquisitive Trader will be used  to share my experiences as an investor getting back into trading the markets. In June 2014 I joined the staff at TradingPub, and I am responsible for helping to book speakers for free webinars. Each week, I am exposed to a wealth of information from leading industry experts who teach how to trade the financial markets. When I come across interesting trading strategies, I will summarize my thoughts and share a link to the archived webinar. As I develop my own trading plan, I will also share some of my personal successes and failures. Responsible comments are welcome, but to avoid flaming posts and spam, I will be moderating all comments. I hope you find this blog useful, and wish you the very best on your journey trading the markets.

Disclaimer

The opinions expressed in this blog are solely those of the author, and should not be construed as trading advice. I am not a registered or certified financial planner. There is a very high degree of risk involved in trading. Past results are not indicative of future returns. All individuals affiliated with this site assume no responsibilities for your trading and investment results. The indicators, strategies, columns, articles and all other features are for educational purposes only and should not be construed as investment advice. Information for futures trading observations are obtained from sources believed to be reliable, but we do not warrant its completeness or accuracy, or warrant any results from the use of the information. Your use of the trading observations is entirely at your own risk and it is your sole responsibility to evaluate the accuracy, completeness and usefulness of the information. You must assess the risk of any trade with your broker and make your own independent decisions regarding any securities mentioned herein.

Tuesday, July 14, 2015

Patience Pays Off with the Nadex "Strudel" Strategy on the DAX Index


Every morning, I trade the the 7am-9am Germany 30 (DAX) strategy with Nadex binary options. I call it the "Strudel" strategy, because it's a delicious breakfast trade. This strategy was based on the observation from Tom Busby, a veteran Futures trader who observed that the 7am EST hourly candlestick of the Germany 30 (DAX) Index is a pivot point that determines the direction of that market for the following hour a great majority of the time.

The rules for the strategy are remarkably simple:

  • Select the 7am-9am EST Nadex time period for the Germany 30 (DAX) Index.
  • If the 7am EST hourly candlestick is BULLISH, then BUY at the first Nadex strike price available BELOW the opening price of hourly candlestick.
  • If the 7am EST hourly candlestick is BEARISH, then SELL at the first Nadex strike price available ABOVE the opening price of hourly candlestick.
This strategy has been remarkably consistent. Over the past 60+ trading days, this pattern has repeated itself about 90 percent of the time. Just be patient and watch the 7am hourly candlestick develop. Once it's confirmed bullish, then buy. If it's confirmed bearish, then sell. If you want to be "super-safe", don't make a trading decision until 8am, after the 7am hourly candlestick has closed.

But a key word with this strategy is patience. One of the biggest mistakes traders make with this strategy is to jump the gun and pull the trigger too early on this strategy. Let's take a look at this 15-minute Nadex chart:

15 minute Nadex Chart on the Germany 30 (DAX) Index. Click on Chart to Enlarge.
The first 2 15-minute candles at the 7am open are bullish. The market had been riding a downtrend, but appeared to be reversing. It was riding above the 8 EMA and the MACD just crossed over from bearish to bullish. For many, it would be easy to assume that the hourly candlestick would close bullish, triggering a BUY.
But now let's take a look how the first hour of trading played out on the hourly charts:

Hourly Nadex Chart. Click to Enlarge

On the hourly charts, you can see that the market was on a steep downtrend. The bullish move on the 15-minute charts above was simply a retracement back to the 8 EMA, before the market continued it's downward path. The hourly candlestick closed BEARISH, triggering a SELL from the first Nadex strike price ABOVE the opening price.

But a little more patience was warranted. At 8:30am, several economic news reports (Retail Sales)  were due to be released. The decision was made to sit on the sidelines and wait for the reports to be released befor placing my SELL order. At 8:30, the econ news was released:


Econ News courtesy of Investing.com
As you can see the news was bearish, and the market dove. I quickly placed a SELL order, risking $80.75 to make $19.25. That may not sound like much reward, but I felt highly confident that this trade would expire successfully with little stress. And it did. Here's how the trade played out:
5 Minute Nadex Charts. Click on Chart to Enlarge
On this 5 minute chart, you can see how the market was bullish in the first half hour, before diving and turning bearish. At 8:30, you can see how the economic news affected the market. The SELL order was a high risk, low reward trade, but it was never threatened. It was a quick $19.25 per contract trade, less $1.80 in exchange fees.

And that will buy a Strudel.

Free Nadex Education Reminder:


Curious about Nadex? Open a Free, 2-Week Nadex Demo Account!
Nadex is available to trade in 24 countries!

Video: Breakfast, Lunch & Dinner Trades with Nadex
By Cam White, TradingPub


The Purpose of this Blog


The Inquisitive Trader will be used  to share my experiences as an investor getting back into trading the markets. In June 2014 I joined the staff at TradingPub, and I am responsible for helping to book speakers for free webinars. Each week, I am exposed to a wealth of information from leading industry experts who teach how to trade the financial markets. When I come across interesting trading strategies, I will summarize my thoughts and share a link to the archived webinar. As I develop my own trading plan, I will also share some of my personal successes and failures. Responsible comments are welcome, but to avoid flaming posts and spam, I will be moderating all comments. I hope you find this blog useful, and wish you the very best on your journey trading the markets.

Disclaimer

The opinions expressed in this blog are solely those of the author, and should not be construed as trading advice. I am not a registered or certified financial planner. There is a very high degree of risk involved in trading. Past results are not indicative of future returns. All individuals affiliated with this site assume no responsibilities for your trading and investment results. The indicators, strategies, columns, articles and all other features are for educational purposes only and should not be construed as investment advice. Information for futures trading observations are obtained from sources believed to be reliable, but we do not warrant its completeness or accuracy, or warrant any results from the use of the information. Your use of the trading observations is entirely at your own risk and it is your sole responsibility to evaluate the accuracy, completeness and usefulness of the information. You must assess the risk of any trade with your broker and make your own independent decisions regarding any securities mentioned herein.

Thursday, July 9, 2015

Trusting the Probabilities on a Nadex FTSE 100 Strategy


Today's Nadex trade for the FTSE 100 Index required trusting a key indicator along with historical probabilities of success for a strategy that has been backtested for several months. The FTSE100 is an index of the top 100 companies traded on the London Exchange.

Over the past 62 trading days, the FTSE 100 has displayed a pattern between 9am-11am EDT that has repeated itself 47 out of 62 times, or slightly better than 75 percent of the time. If you followed the rules of this strategy, and got in on every trade, then your trade would have expired successfully 47 out of 62 times.

Today, it looked like an exception to the rule was coming into play. The setup looked dangerous, and the trade required patience for the right entry.

But first, here are the rules for the 9am-11am FTSE 100 "Footsie" Strategy:


Click on Nadex Chart to Enlarge
Notice the 9am hourly candlesticks above. Can you see that the following 10am candlestick never challenges the opening price of the 9am candlestick? In fact, the 10am candlestick tends to continue in the same direction that was established by the 9am candlestick. To back test this, simply pull up the hourly charts of the FTSE 100 on Investing.com and go back 60 days. Compare the 9am EDT hourly candlestick  to the 10am hourly candlestick. You will see how frequently this pattern repeats itself.

The same phenomenon occurs with the 7am-9am German "Strudel" strategy that I have written about extensively. Complete rules for the "Strudel" strategy are included in the free eBook from TradingPub, entitled "Trading Made Simple: Strategies that Risk $100 or Less".

The rules for this new strategy are very simple to execute:


  • Select the 9am-11am EST Nadex time period for the FTSE 100 Index.
  • If the 9am EST hourly candlestick is BULLISH, then BUY at the first Nadex strike price available BELOW the opening price of the 9am hourly candlestick.
  • If the 9am EST hourly candlestick is BEARISH, then SELL at the first Nadex strike price available ABOVE the opening price of the 9am hourly candlestick.
This strategy has been very consistent over the past 3 months. Just be patient and watch the 9am hourly candlestick develop. Once it's confirmed bullish, then buy. If it's confirmed bearish, then sell. If you want to be "super-safe", don't make a trading decision until 10am, after the 9am hourly candlestick has closed.

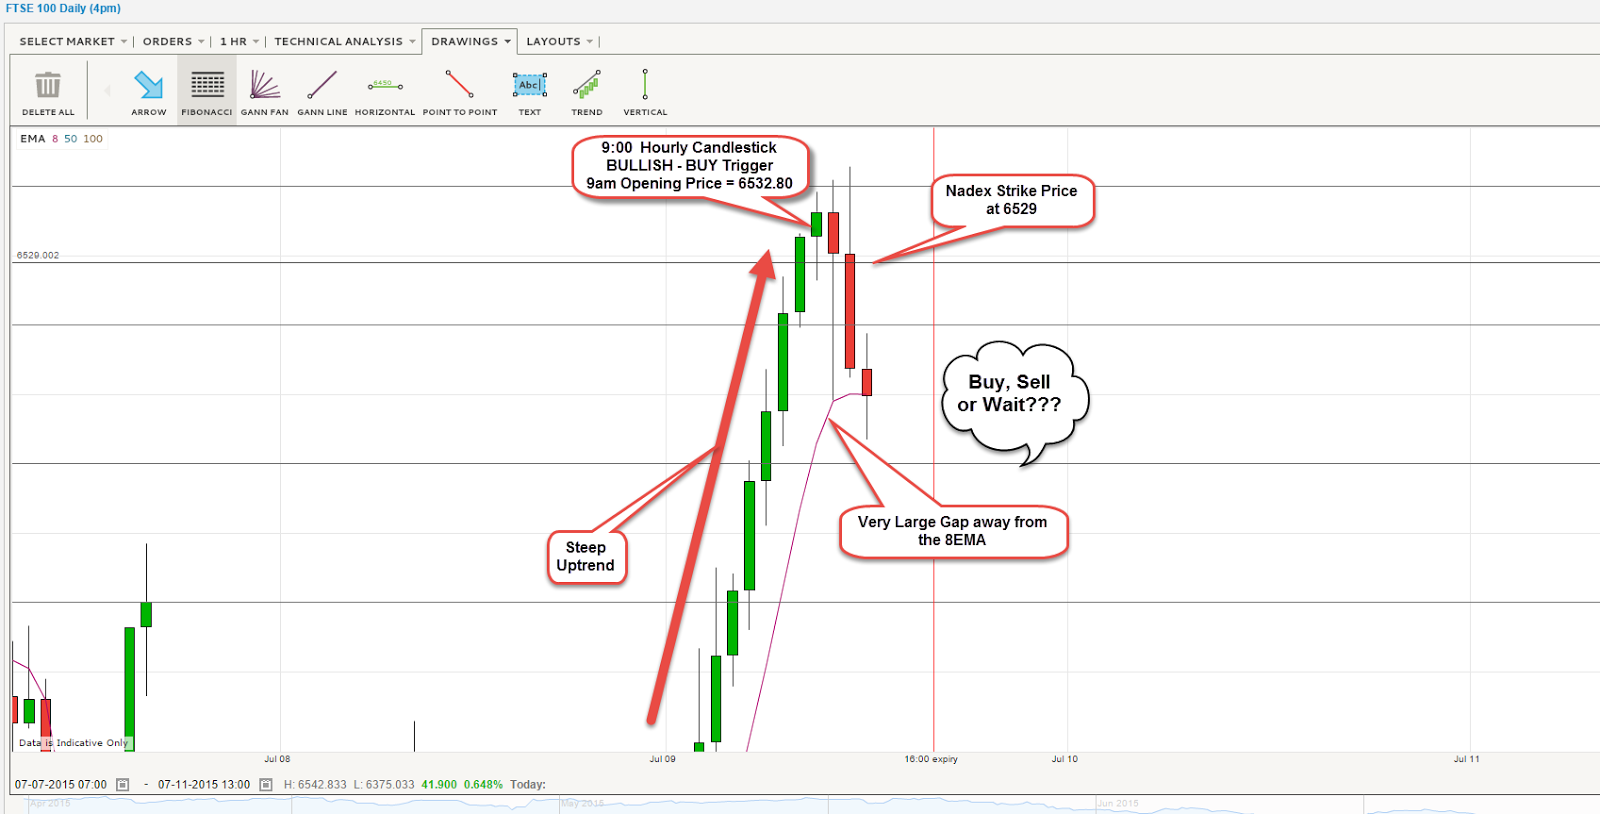
Trading this strategy today required patience and caution, as the chart below illustrates:

Nadex Hourly Chart of the FTSE 100 Index. Click on Chart to Enlarge

The FTSE 100 Index had been riding a very steep uptrend for 7 consecutive hours going into the 9am hour. The 9am hourly candlestick was also developing bullish, but it was also gapping significantly away from the 8 EMA indicator. When the market gaps away from the 8 EMA (also known as the "T-Line") it almost always has to come back. It's like a rubber band. You can pull the market away from the 8 EMA, but it always snaps back.

With a bullish 9am hourly candle, it would normally automatically trigger a BUY at the first strike price below the 9am open. But I didn't like how far the market had gapped away from the 8EMA, and I sensed it would snap back with a vengeance. So I decided to sit on the sidelines and wait to see what the market would do.

Sure enough, the market snapped back with a vengeance. It blew through the strike price, and kept going all of the way down until it touched the 8 EMA.

So now I had a decision to make. Will the market reverse direction and head back north, and settle above the 1st strike price below the 9am open? With 40 minute left in the trade, it sure didn't look like it. But I reminded myself that this strategy has a 75% success rate, and a reversal looked like it was imminent. If I placed that trade, it was an Out-of-the-money trade, risking only $30 to make $70 per contract. Low risk, high reward. I pulled the trigger and went for it. Here's how the trade played out.

5 Minute Nadex Chart. Click on Chart to Enlarge

From 10am-10:30, the market kept going downward until it touched the 8EMA on the Hourly charts. Then it abruptly reversed and headed straight up, expiring for a full profit of $70 per contract, less $1.80 in exchange fees.


Conclusion:

In hindsight, this was a trade I probably should have passed on.  It wound up working out exactly as I had predicted, but it could have easily lost. The market had to dive sharply toward the 8 EMA, and then bounce back up. I also had to have confidence in the recent historical probability of success. Those were two variables I had to trust before I pulled the trigger. But since I was only risking $30 per contract for a potential $70 reward, I wasn't too nervous.


Try this Strategy Out for Yourself. Download a 2 Week Nadex Demo.
Nadex is now available for trading in 47 countries. You will have complete access to the Nadex trading platform, and your demo account will be funded with $25,000 in play money.

Free Nadex Education Reminder:


  • Thursday, July 9  Introduction to Binary Options 9pm EST Register Here
  • For the full Calendar of July Nadex Educational events, click here


To view a other high-probability Nadex trading strategies, click below:


The Purpose of this Blog


The Inquisitive Trader will be used  to share my experiences as an investor getting back into trading the markets. In June 2014 I joined the staff at TradingPub, and I am responsible for helping to book speakers for free webinars. Each week, I am exposed to a wealth of information from leading industry experts who teach how to trade the financial markets. When I come across interesting trading strategies, I will summarize my thoughts and share a link to the archived webinar. As I develop my own trading plan, I will also share some of my personal successes and failures. Responsible comments are welcome, but to avoid flaming posts and spam, I will be moderating all comments. I hope you find this blog useful, and wish you the very best on your journey trading the markets.

Disclaimer

The opinions expressed in this blog are solely those of the author, and should not be construed as trading advice. I am not a registered or certified financial planner. There is a very high degree of risk involved in trading. Past results are not indicative of future returns. All individuals affiliated with this site assume no responsibilities for your trading and investment results. The indicators, strategies, columns, articles and all other features are for educational purposes only and should not be construed as investment advice. Information for futures trading observations are obtained from sources believed to be reliable, but we do not warrant its completeness or accuracy, or warrant any results from the use of the information. Your use of the trading observations is entirely at your own risk and it is your sole responsibility to evaluate the accuracy, completeness and usefulness of the information. You must assess the risk of any trade with your broker and make your own independent decisions regarding any securities mentioned herein.

Tuesday, July 7, 2015

A Low Risk, High Reward Trade on the S&P 500 Morning "V" Pattern with Nadex


Morning "V" Pattern on the S&P 500
By Cam White, TradingPub

Out of the Money (OTM) trades with Nadex offer the opportunity to make significant profits on very little money risked. Since the probability of OTM trades expiring successfully is low, it is important to have a strategy that predicts a significant breakout or a reversal in the markets.

Today, the S&P 500 futures dove over 27 points between the 9:30 EDT Opening Bell and 11:30 EDT on worries over Greece, China and a broadening US Trade Deficit. Would the market bounce off support, or continue its free fall?

I looked at the the US 500 market on the daily charts, 4-Hour charts and smaller time frames. It looked like the market would find support at 2040. If support held, I was expecting a bounce off support. The MACD was showing that a potential reversal was imminent on multiple time frames. It was time to be patient and wait for a reversal to develop.


4 Hour Nadex Charts of the US 500 Index. Click on Chart to Enlarge.

The area around 2040 had been tested several times over the past few days.It was time to see if it would hold again. I switched to the 5 minute and 1-minute charts around 11:30 looking for signs of a reversal. After the market started to reverse on the smaller time frames, the MACD showed a reversal on the 15 minute charts.

That was my trigger to BUY on the reversal. Now the question was where would my strike price be? I could place an In-The-Money (ITM) trade below 2040, risking $70 to make $30. I could also place an At-The-Money trade (ATM) at 2040, risking $50 to make $50.

But I didn't entirely trust the market, so I opted to place an Out-of-the-Money (OTM) risking $20 to make $80 per contract. Psychologically, I like placing trades like this when the markets are acting crazy. I have very little money risked, for a potentially large return. But OTM trades need a good trigger, like a reversal, a strong continuation move, or a news event to accelerate the movement of the market.

Here's how today's Morning "V" trade played out:


15 Minute Nadex Chart. Click on Chart to Enlarge
Just before 11:30am EDT, the Market showed signs of reversal on the smaller time frames. The 15 minute Charts were showing a bullish crossover. Stochastics were on the rise. Now it was time to find a strike price that gave me the OTM  risk/reward I was looking for. I bought 5 contracts to BUY the US 500 Index at 2050, risking $20 to make $80 per contract. Within one hour, the market climbed up and through the 2050 strike price. At that time, I was already up $100, and I could have exited the trade for a 1:1 risk/reward ratio.

Now I had a decision to make: Do I cash out and take a $100 sure profit, or should I let the trade continue and collect more profits? All indicators were still bullish, so I switched to a smaller time frame, and was prepared to exit on a hard reversal. I felt that the 2054 area might act like resistance, so I was prepared to exit at that price level. At 2054, the market briefly started to show signs of reversal.

I cashed out at around 2054 for a gross profit of $211.25, less $9.00 in exchange fees. Here are the transaction details:


I bought 5 contracts, risking a maximum of $100 to make a maximum of $400. As crazy as markets were behaving, I was quite happy exiting the trade early for a profit of over $200. If I had allowed the contract to expire at 4:15, it would have settled for the full $400 profit. But that was by no means certain when I chose to exit.


Conclusion:

Finding OTM trading opportunities with Nadex offers low risk for potentially high reward. These trades can be really fun when they work. Today's trade counted on a bounce off support, and the formation of a "V" pattern. If that didn't happen, I would have exited the trade quickly to minimize losses.


In the free eBook "Trading Made Simple - Strategies that Risk less than $100", you will find 11 strategies for trading Nadex from some of the best Nadex educators in the market. It's a free eBook, courtesy of TradingPub.


Important Note: OTM strategies only work if the markets are poised for a strong reversal or breakout. If a reversal or breakout doesn't happen, you will likely lose most or all of your capital risked. Fortunately, in this case. $20 per contract was a maximum risk worth taking.
Free Nadex Education Reminder:

  • Thursday, July 9  Introduction to Binary Options 9pm EST Register Here
  • For the full schedule of free February Nadex webinars, click here.

Try Nadex Today!  Open Your Free, 2-Week Nadex Demo Account!
Nadex is now available in 47 countries! Your fully-functional demo account will be funded with $25,000 in play money.


Breakfast, Lunch and Dinner Trades with Nadex
Cam White, TradingPub


The Purpose of this Blog


The Inquisitive Trader will be used  to share my experiences as an investor getting back into trading the markets. In June 2014 I joined the staff at TradingPub, and I am responsible for helping to book speakers for free webinars. Each week, I am exposed to a wealth of information from leading industry experts who teach how to trade the financial markets. When I come across interesting trading strategies, I will summarize my thoughts and share a link to the archived webinar. As I develop my own trading plan, I will also share some of my personal successes and failures. Responsible comments are welcome, but to avoid flaming posts and spam, I will be moderating all comments. I hope you find this blog useful, and wish you the very best on your journey trading the markets.

Disclaimer

The opinions expressed in this blog are solely those of the author, and should not be construed as trading advice. I am not a registered or certified financial planner. There is a very high degree of risk involved in trading. Past results are not indicative of future returns. All individuals affiliated with this site assume no responsibilities for your trading and investment results. The indicators, strategies, columns, articles and all other features are for educational purposes only and should not be construed as investment advice. Information for futures trading observations are obtained from sources believed to be reliable, but we do not warrant its completeness or accuracy, or warrant any results from the use of the information. Your use of the trading observations is entirely at your own risk and it is your sole responsibility to evaluate the accuracy, completeness and usefulness of the information. You must assess the risk of any trade with your broker and make your own independent decisions regarding any securities mentioned herein.

Saturday, July 4, 2015

My 3rd Quarter Nadex Trading Plan.


7am-9am "Strudel" Strategy

One year ago, I started my trading journey with Nadex. I was immediately drawn to this trading platform because I liked the idea that all of my trades were capped with a maximum risk and a maximum reward. There was no way a trade could run away from me. I also liked the fact that Nadex is a federally regulated exchange (CFTC) and not an offshore bucket shop.

Trading isn't easy. If it were, everyone would be raking in money hand over fist. It requires patience, alertness and hours of study to manage your trading emotions and to master strategies with a proven track record of performance.

Like most successful veteran 
traders I've talked to, I have made my fair share of rookie mistakes. Name a trading mistake, and I'm pretty sure I've made it. 


One of the key elements of successful trading is to have a trading plan. This is your road map to trading. Without a trading plan, traders can trade randomly, jump in on untested theories, and lose money.

In this article, I'm going to share how I am going to map out my trading day for the 3rd Quarter of 2015 in my live trading account.

Daily Trading Calendar:

Before I start trading, I check the Economic Calendar for the day on Investing.com. During Earnings Season, I also take a look at the Earnings Calendar  on Morningstar.com  to see which companies are reporting for that day, and whether results are being released before the market open or after market close.  Finally, I take a quick look at Google News, CNBC and Bloomberg  to see if there's any overnight geopolitical news that might affect the markets. Now I'm ready to trade.


5:00am - 8:00am EDT: The London Breakout Strategy
London Breakout Strategy Feb 5, 2015 (Click on Chart to Enlarge)

If I wake up early enough, I check the Economic Calendar, and pull up the charts for the GBP/USD. I watch the price movement of this currency pair between 2am-5am. What I'm looking for is to see if a breakout is occurring during this time frame. If there's economic news being released out of the UK, it normally happens at 4:30 am. If the market breaks out bullish, I BUY from support, If the GBP/USD breaks bearish, I SELL from resistance. I set my expiration for 3pm daily on this trade.

During the 4th Quarter of 2014, I had a great deal of success with this trade. Not so much in the 1st Quarter of 2015. With the US Dollar Index trading at near 14 year highs, and the GBP/USD trading at 12 year lows, there was a lot of tension in this trade. Sometimes negative UK news reports would result in a huge uptrend. The real culprit was the Dollar Index falling that day. I find that this strategy works more reliably when there is a little more balance between the strength of the US Dollar vs. the British Pound.

This is not my favorite strategy, because it requires me to get up really early. But if I'm awake and I really like the setup, then I have no problem trading this strategy in my live account.

7:00-9:00am EDT - German DAX "Strudel" Strategy

"Strudel" Strategy February 20, 2015 - Click on Chart to Enlarge


This is my favorite trading strategy, and it has held up remarkably well since I first developed it in August 2014. This was based on a Futures strategy from Tom Busby that I adapted and applied to Nadex. It doesn't require special charts or lots of indicators. Simply pull up the hourly charts on the Nadex Germany 30 (DAX) Index at 7am EDT and monitor the development of the hourly candlestick. Once you are convinced that the hourly candlestick is bullish, then BUY from the first Nadex strike price BELOW the 7am hourly opening price. Once you are convinced that the hourly candlestick is bearish, then SELL from the first Nadex strike price ABOVE the 7am hourly opening price. It's really that simple. Click on the link above for a more detailed description of this strategy.

Over the past 60 trading days, which is almost 3 months of trading, the rules of this strategy held 90% of the time. If you managed to get into every trade, then 54 of your 60 trades would have expired in the money for full profit. 6 of those trades would have settled out of the money.

Important Note: There is no DAX feed on ThinkorSwim. To get this feed, you will need Nadex charts, Investing.com, Ninja Trader or other charting platforms with a DAX feed.

9:00-11:00am EDT - The FTSE 100 "Footsie" Strategy


"Footsie" Strategy June 24  2015  Click on Chart to Enlarge


Just like the "Strudel" Strategy, the 9:00-11:00am "Footsie" Strategy is remarkably consistent. Simply pull up the hourly charts on the Nadex FTSE 100 Index at 9am EDT and monitor the development of the hourly candlestick. Once you are convinced that the hourly candlestick is bullish, then BUY from the first Nadex strike price BELOW the 9am hourly opening price. Once you are convinced that the hourly candlestick is bearish, then SELL from the first Nadex strike price ABOVE the 7am hourly opening price. It's really that simple. Click on the link above for a more detailed description of this strategy.

Over the past 60 trading days, which is almost 3 months of trading, the rules of this strategy held 75% of the time. If you managed to get into every trade, then 45 of your 60 trades would have expired in the money for full profit. 15 of those trades would have settled out of the money, so loss management is more important. With a recent 75% probability of success, I still like this strategy.

Important Note: There is no FTSE 100 feed on ThinkorSwim. To get this feed, you will need Nadex charts, Investing.com, Ninja Trader or other charting platforms with a FTSE 100 feed.

11:00am-1:00pm EDT: The Lunchtime "Caret" Trade

Lunchtime "Caret" Trade - Click on Chart to Enlarge


I don't trade this strategy daily, but I do keep an eye on it to see if a setup is in play. If the S&P 500 is rising going into the 11am hour and continues to rise, I look for signs of exhaustion and reversal on declining lunchtime volume. If a reversal is confirmed, then I SELL from a Nadex strike price above the peak of the reversal. A very nice trade if the setup reveals itself. For full details on this strategy, Click here.

1:00-7:00pm EDT - GBP/USD "Afternoon Delight" Trade

"GBP/USD "Afternoon Delight" June 24, 2015  Click on Chart to Enlarge
This is a very consistent strategy that is extremely simple to execute. All you really need is a 15 minute chart of the GBP/USD and the MACD indicator. I'm looking for a MACD crossover after 1pm. If the crossover is BULLISH, then I BUY the GBP/USD at a strike price BELOW where the market was at the crossover. If the crossover is BEARISH, then I SELL the GBP/USD at a strike price ABOVE where the market was at the crossover. Pretty simple. The only thing I don't like about thisstrategy is that Nadex goes dead from 5pm-6pm EDT. Still, I rarely lose when I trade this strategy. Click Here for details on this strategy.

8:00-10:00pm - Nikkei 225 "Kanpai" Strategy


4 Consecutive Days of the Nikkei 225 "Kanpai" Strategy. Click on Chart to Enlarge
Kanpai means "Cheers" in Japanese, and this is a nice trade to end the day. Just like the "Strudel" strategy, the 8pm hourly candlestick controls the 9pm hourly candlestick the vast majority of the time. Simply pull up the hourly charts on the Japan 225 (Nikkei) Index at 8pm EDT and monitor the development of the hourly candlestick. Once you are convinced that the hourly candlestick is bullish, then BUY from the first Nadex strike price BELOW the 8pm hourly opening price. Once you are convinced that the hourly candlestick is bearish, then SELL from the first Nadex strike price ABOVE the 8pm hourly opening price. It's really that simple. Click on the link above for a more detailed description of this strategy.

Over the past 60 trading days, which is almost 3 months of trading, the rules of this strategy held 85% of the time. If you managed to get into every trade, then 52 of your 60 trades would have expired in the money for full profit. 8 of those trades would have settled out of the money.

Important Note: There is no Nikkei 225 feed on ThinkorSwim. To get this feed, you will need Nadex charts, Investing.com, Ninja Trader or other charting platforms with a Nikkei 225 feed.

A Full Day of Trading Opportunities

The strategies I follow cover a full day of trading from 5am-10pm. That does not mean I am glued to my computer for 17 hours looking for trading opportunities. Once I hit my daily profit target, I'm done for the day. Sometimes I just don't fully trust a strategy, and I move on. And yes, some days I take a break from trading.


Important Note: If you are brand new to trading these strategies, please don't take my word as gospel.  Try them out for yourself in demo mode until you are convinced whether it's the right strategy for your trading style.


Free Nadex Education Reminder:


  • Monday, July 6 Directional Trading with Nadex Spreads 7:00pm EST  Register Here


Curious about Nadex? Open Your Free,
2-Week Nadex Demo Account!

Nadex is available to trade in 46 countries!


Video: Breakfast, Lunch & Dinner
Trading Strategies with Nadex

By Cam White, TradingPub


The Purpose of this Blog


The Inquisitive Trader will be used  to share my experiences as an investor getting back into trading the markets. In June 2014 I joined the staff at TradingPub, and I am responsible for helping to book speakers for free webinars. Each week, I am exposed to a wealth of information from leading industry experts who teach how to trade the financial markets. When I come across interesting trading strategies, I will summarize my thoughts and share a link to the archived webinar. As I develop my own trading plan, I will also share some of my personal successes and failures. Responsible comments are welcome, but to avoid flaming posts and spam, I will be moderating all comments. I hope you find this blog useful, and wish you the very best on your journey trading the markets.

Disclaimer

The opinions expressed in this blog are solely those of the author, and should not be construed as trading advice. I am not a registered or certified financial planner. There is a very high degree of risk involved in trading. Past results are not indicative of future returns. All individuals affiliated with this site assume no responsibilities for your trading and investment results. The indicators, strategies, columns, articles and all other features are for educational purposes only and should not be construed as investment advice. Information for futures trading observations are obtained from sources believed to be reliable, but we do not warrant its completeness or accuracy, or warrant any results from the use of the information. Your use of the trading observations is entirely at your own risk and it is your sole responsibility to evaluate the accuracy, completeness and usefulness of the information. You must assess the risk of any trade with your broker and make your own independent decisions regarding any securities mentioned herein.